 Clarify
 Nederlands
 English
Block diagrams part 2
The weakest link
November 30, 2022
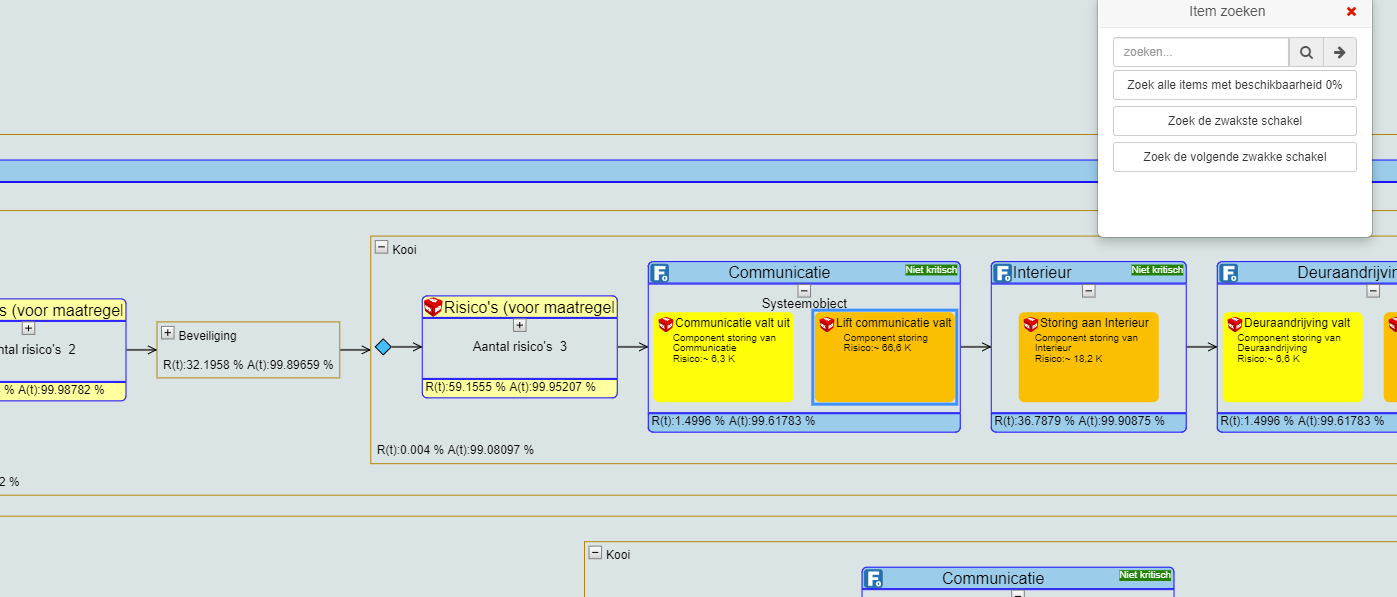
With a block diagram you make the entire chain visible. From input to output. The overall process is projected in blocks that represent individual sub-processes.
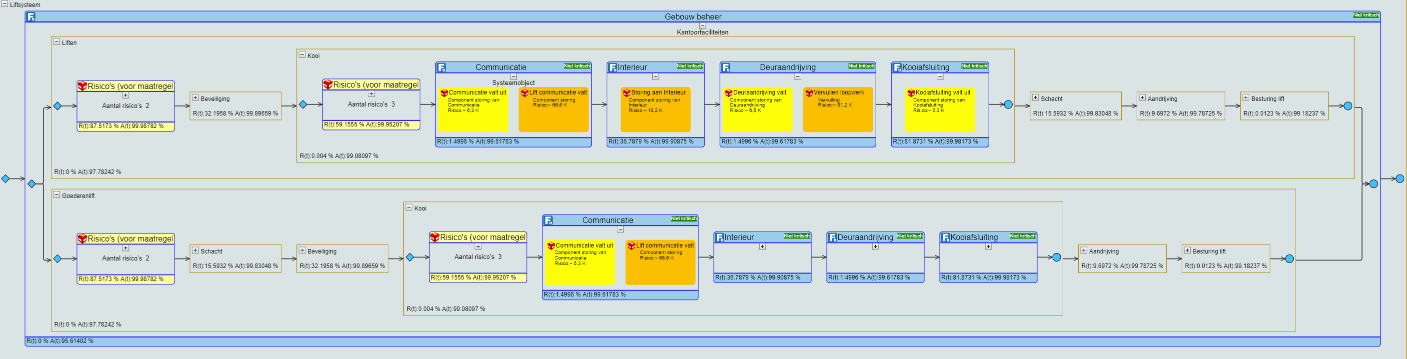
Where is the weakest link?
Using the block diagram, Clarify immediately shows the answer to the question of where the weakest link in the chain is.
It appears immediately. And if you want to find the next weakest link as well, you can have it selected directly, and so on.
This way you can analyse the chain quickly, so that action can be taken to adjust the weakest and weaker links by means of modification and/or extra measures.
In this way you use the block diagram to make the chain stronger. With it you improve and optimise the cost, risk and performance ratio.
More about these clear and handy block diagrams in part 3 of this series.