 Clarify
 Nederlands
 English
Plan of action part 6
Reporting and Presenting
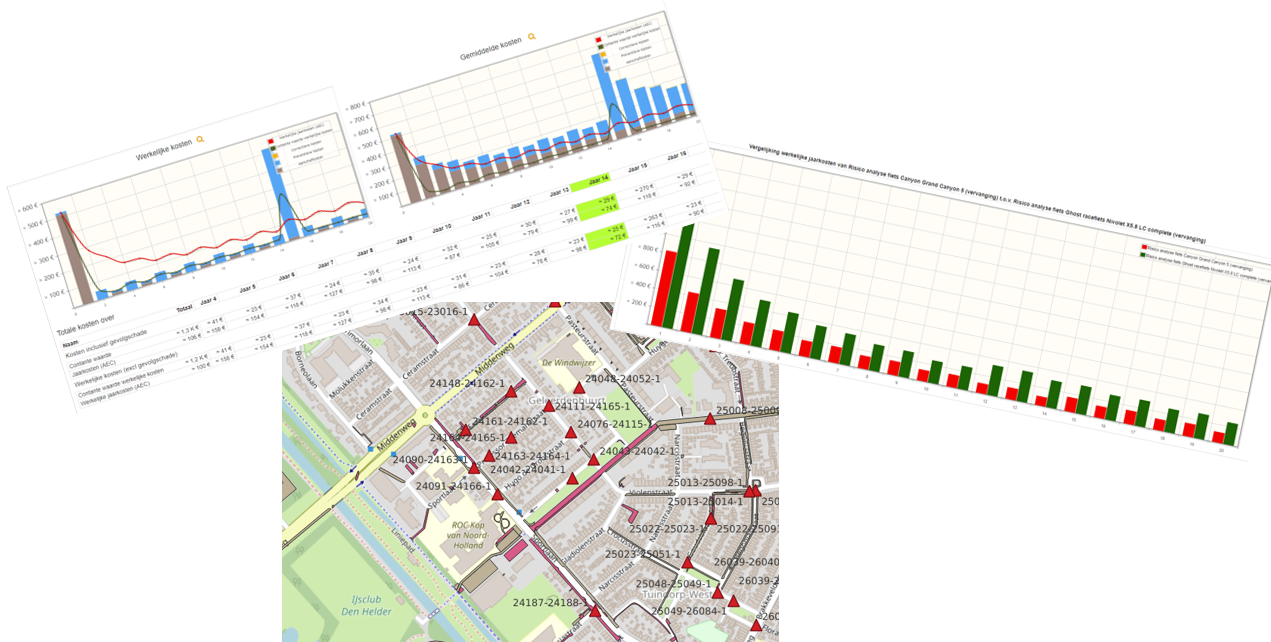
Substantiating choices for new construction or for replacing assets calls for clear reports. But managing management and maintenance also needs easy-to-understand tables, charts and maps.
Clarify was developed from these questions and offers a wide range of possibilities:
🔸 overviews
🔸 charts
🔸 geographic imagery
Everything needed for a clear and well-organised presentation or report.
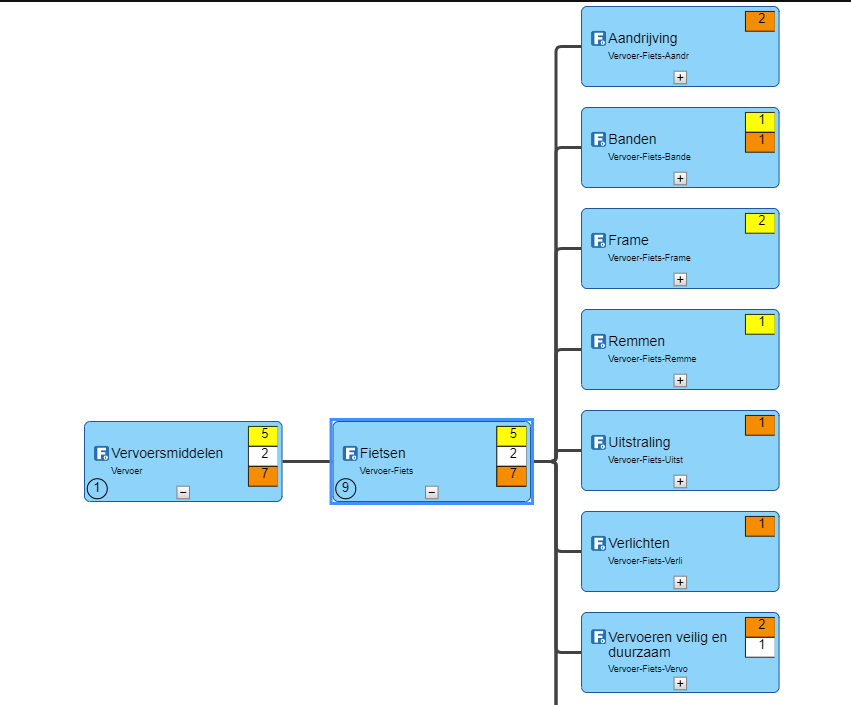
The dashboard, for instance, gives immediate insight into the structure and coherence of the objects, elements and building parts. In this dashboard you also see directly which risks apply to which parts.
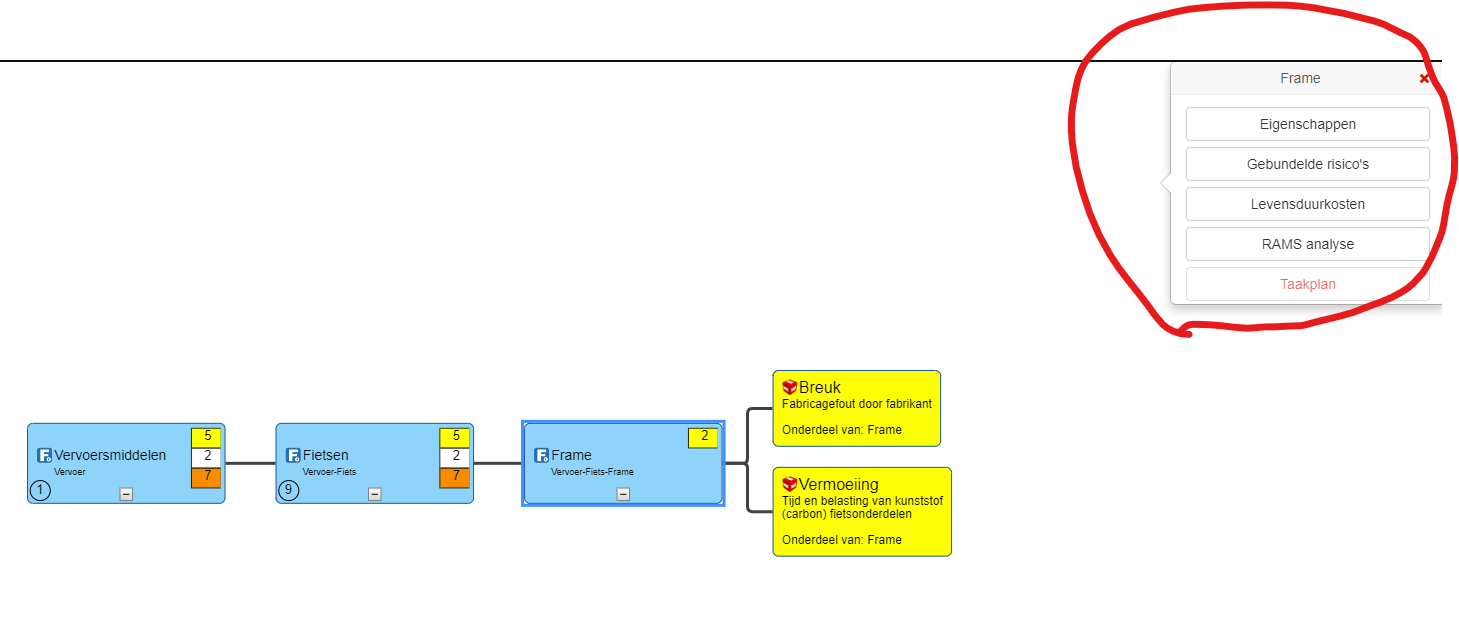
From the dashboard you can click straight through to more in-depth and detailed information. Such as the bundled risks that apply to this object, the life-cycle costs, the block diagram and the task plans.
How easy it is to take in the relevant information graphically and geographically. Images often say more than figures and/or text. Clarify offers you every possibility.
Graphical substantiation to facilitate decision-making. After all, everyone can read a chart of financial consequences over time more easily than extensive text with tables.
The convenience of geographic risk indication shown on a map with colours. Clarify also offers the possibility to combine different asset types, so that logical combining in the work is made easier.
Risk management calls for such reporting capabilities. We provide them with Clarify.
To differentiate more deeply in risk management alongside the well-known FMECA, Clarify also offers the possibility of using a Multi Criteria Analysis. Read more about this in part 7 of our ‘Risk Management Action Plan’.