 Clarify
 Nederlands
 English
Plan of action part 3
Risk analysis
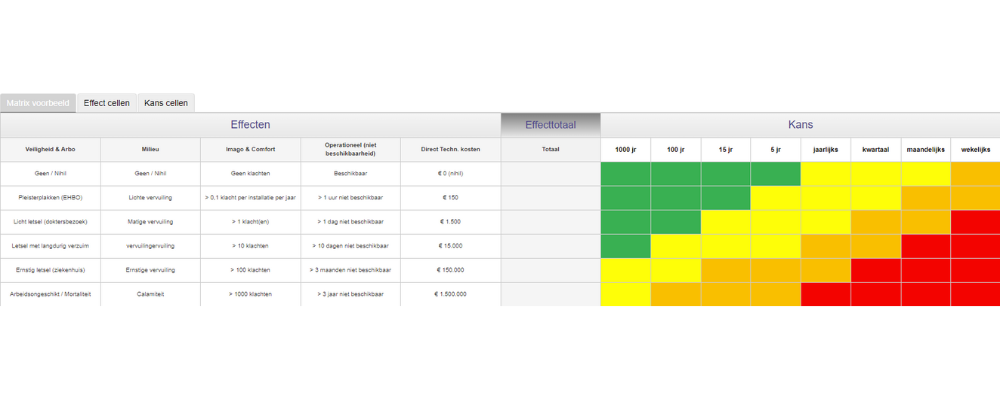
In part 3 of our series ‘Risk Management Action Plan’ we are now almost ready to carry out a risk analysis (RA). We named a risk matrix and the failure modes in our previous blog article. The only thing still missing is a scenario.
With a scenario we indicate the circumstances under which the RA is carried out.
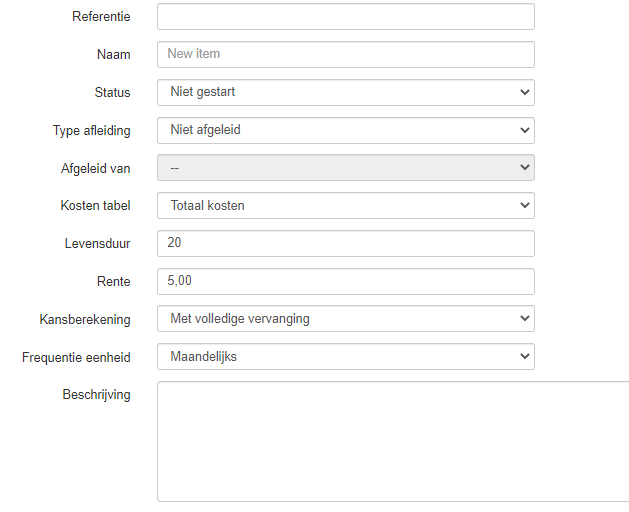
1. Entering a scenario in Clarify
Clarify software helps you combine these three and carry out a valuable analysis. We gain immediate insight into how great the risks are and how they develop in the future.
When setting up an RA, Clarify asks us to enter the starting points.
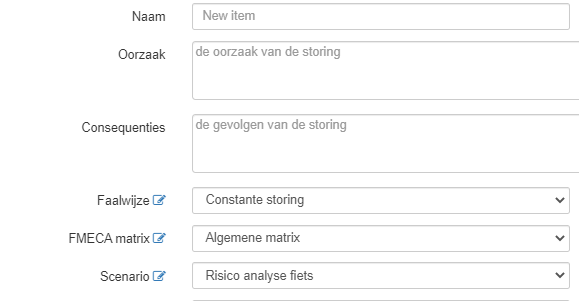
2. Entering the starting points in Clarify
With this we lay the foundation for the RA. The risk is given a name, and the cause and consequences are named. Then an important item: the choice of failure mode. Here we usually select one of the failure modes as discussed in part 4 (rising, falling or constant).
The matrix is the next choice. We select the matrix we have drawn up for this client. And we select the matching scenario.
At last we are ready to discover which risks we run and how we can limit these risks to an acceptable level.
By entering the combination of the expected effects of the failure and the probability of this failure occurring into the matrix, Clarify indicates 2 things:
🔶 the financial impact
🔶 how this risk develops over time
We determine the financial impact on the basis of the various effects. We show the development using the failure mode. The total effect is the sum of the selected effects.
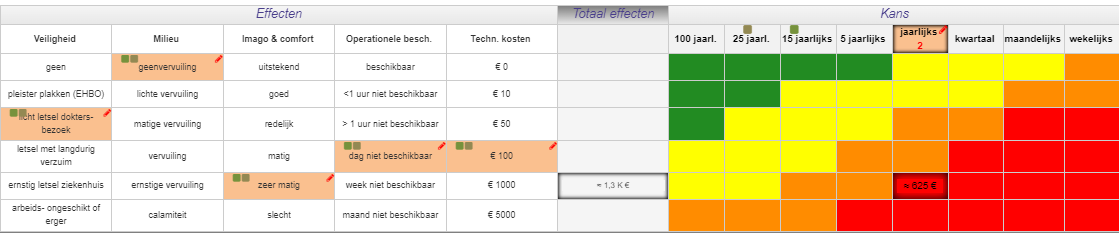
3. Risk matrix – Effect x Probability
The combination of risk matrix with failure mode gives immediate insight into the expected costs of failure.
This is also very useful when deciding whether or not maintenance can be postponed. We are now able to determine directly what the expected failure costs are in the current year and in future years.
The total costs we have to deal with when this risk occurs develop, with a rising failure mode, as shown in image 4. With a constant failure mode they look like image 5.
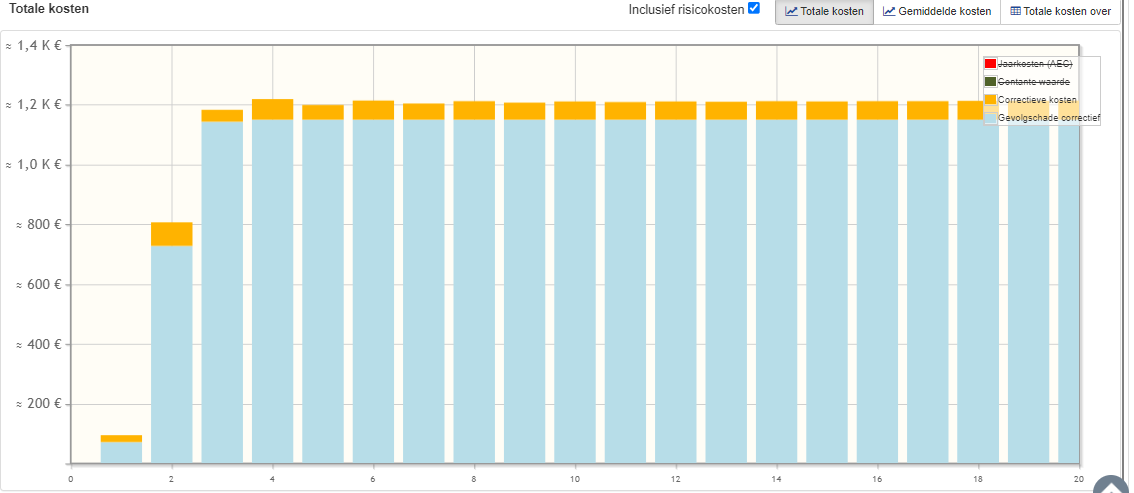
4. Total costs with a rising failure mode
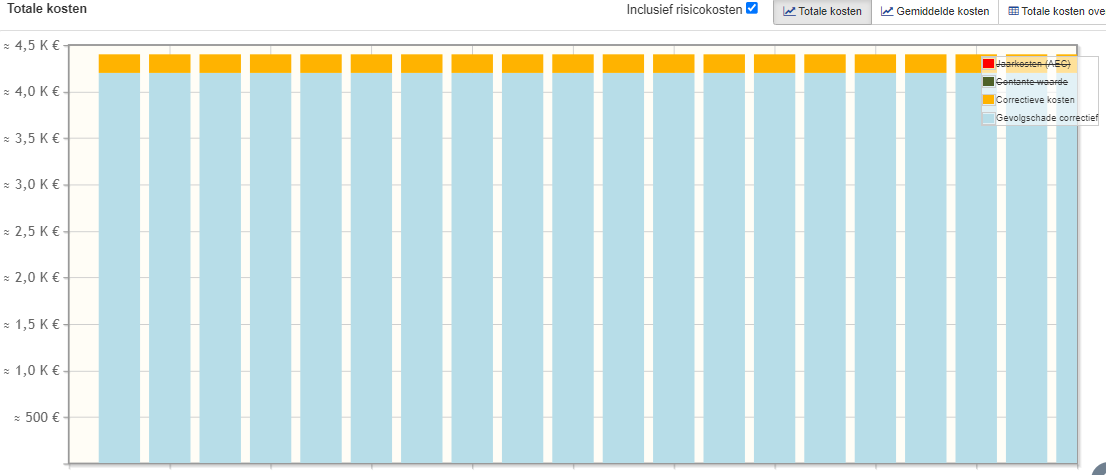
5. Total costs with a constant failure mode
Step by step towards unravelling risk-driven design, management and maintenance.